Share this article
The Most Dangerous Counties in Illinois for Car Accidents
From scenic rural landscapes to charming suburbs and the vibrant cultural hub of Chicago, Illinois is a diverse state where daily life can vary widely depending on where you live.
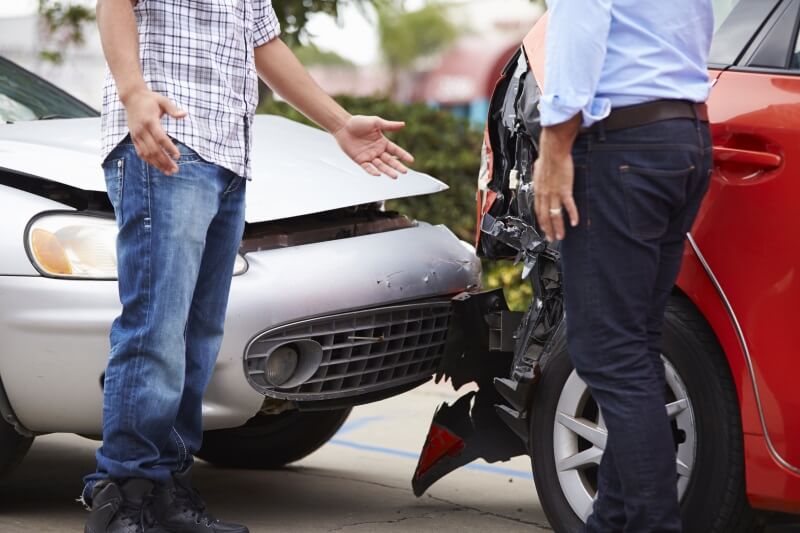
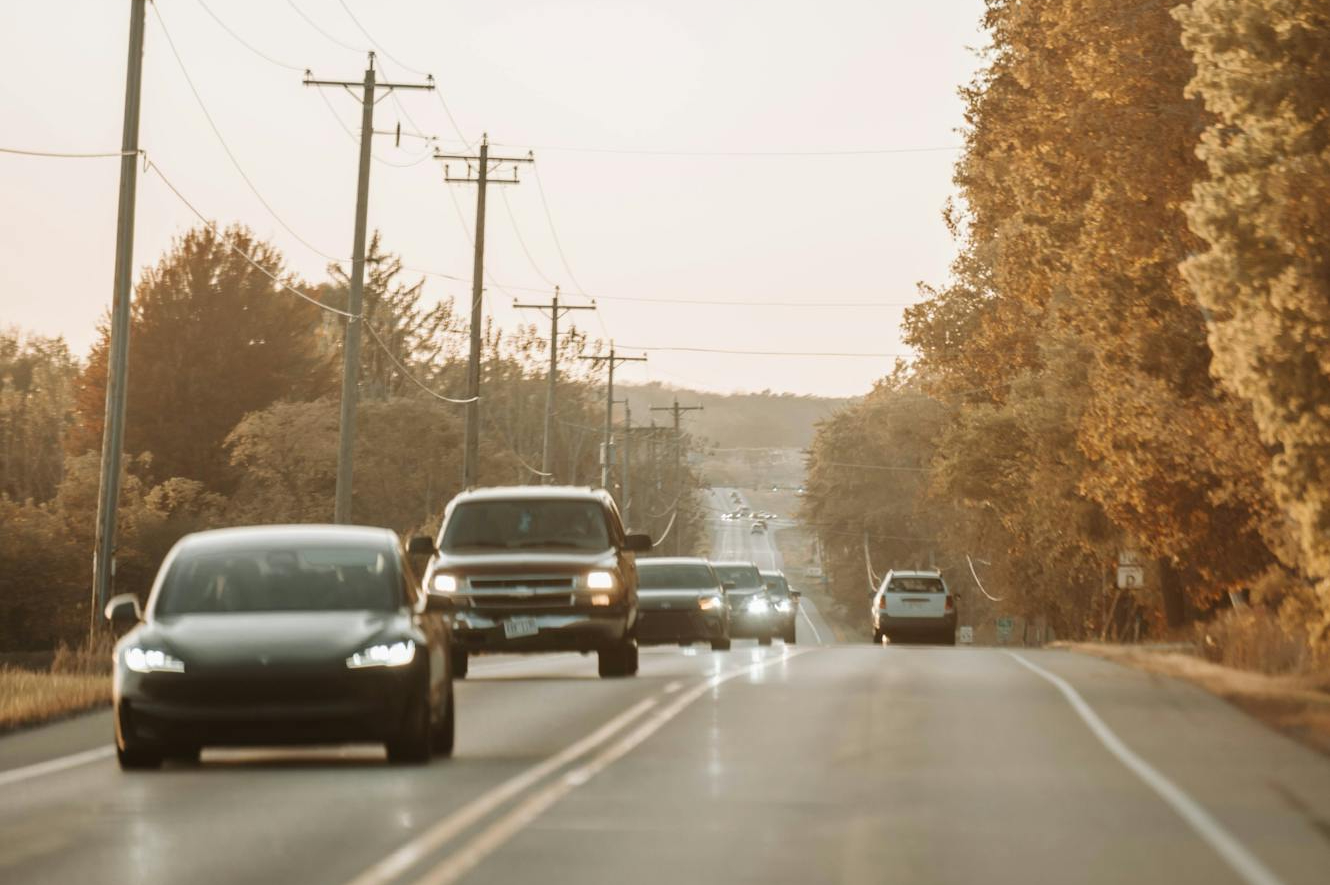
If you currently call Illinois home (or you’re thinking about moving here), you may be wondering how the different parts of the state compare in terms of safety. Whether you’re raising a family here or simply living on your own, it’s essential to understand the risks associated with various regions. This is especially important when it comes to road safety, as a large percentage of Illinois residents will find themselves behind the wheel multiple times every day.
In this article, we’re analyzing data reported by the Illinois Department of Transportation (IDOT) to provide an in-depth look at the most dangerous counties in Illinois for car accidents.
Fast Facts:
- According to the U.S. Department of Health and Human Services, motor vehicle crashes are the second leading cause of death from unintentional injuries in the U.S.
- In 2022, Illinois ranked as the ninth most dangerous state for fatal car crashes—coming in just ahead of New York.
- From 2020–2022, an average of 1,268 people per year died from car accidents in IL.
You may be wondering—do Illinois’s traffic safety statistics accurately reflect conditions statewide? After all, Cook County (home to Chicago) is the second-most populous county in the entire United States. Could this county be swaying the state’s numbers?
To answer this, we’re breaking down traffic data on a county-by-county basis, considering key factors like population density to give a clearer picture of how different regions compare.
If you’re an Illinois resident, someone who is considering making the move to our state, or simply a potential tourist who wants to ensure safe travels, read on for a comprehensive guide to the most dangerous counties in Illinois for car accidents, the factors contributing to these crashes, and the state’s safest regions for drivers.
Key Findings
- Although Cook County saw the highest total number of crashes by far in 2022, it did not have the highest crash rate when you account for population numbers.
- The safest county in Illinois for car accidents is also the least populous county in the state.
- When analyzing traffic safety data, it’s important to consider which counties have major highways and interstates running through them, as these can inflate crash rates—especially for rural counties with small populations.
Mapping Crash Rates Across Illinois’s 102 Counties
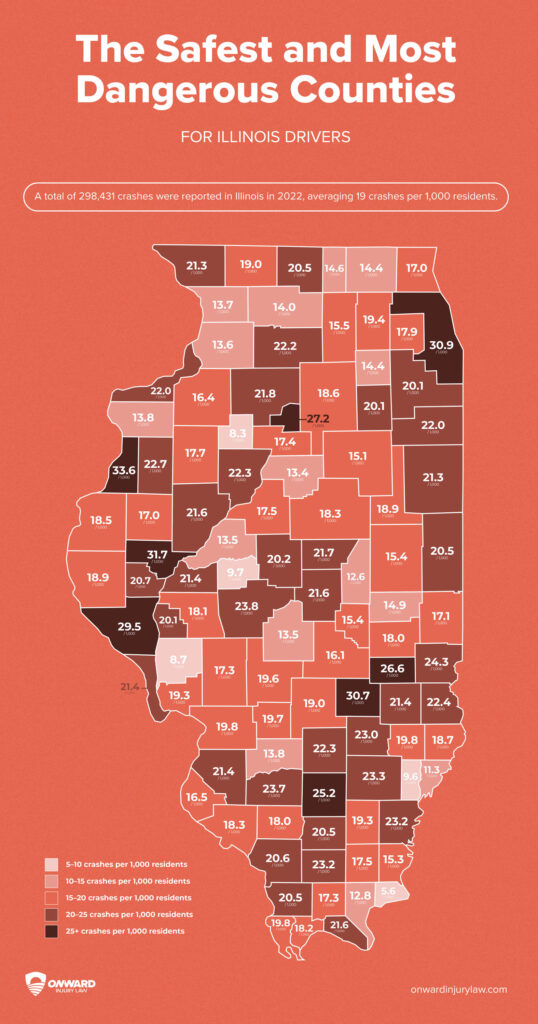
To get a clear picture of the safest and most dangerous counties in IL for drivers, we performed an in-depth analysis of 2022 crash data reported by the Illinois Department of Transportation. Reports from IDOT are not released in real time, so the 2022 data is the most recent report provided by the state at the time of writing.
Rather than focusing solely on total crash numbers, we used a more accurate metric: the crash rate per 1,000 residents. This approach allows for a fairer comparison across the state by accounting for differences in population density.
Key Statistics About Traffic Safety in Illinois
The map above is a great resource for discerning the driving “danger zones” in Illinois. But understanding where crashes happen is only part of the picture. Safe drivers in Illinois also want to know:
- How do most car accidents occur in the state?
- What are the most common risk factors caused by drivers on Illinois roads?
- What are the financial implications of a car accident in Illinois?
Let’s explore these questions using state-reported data.
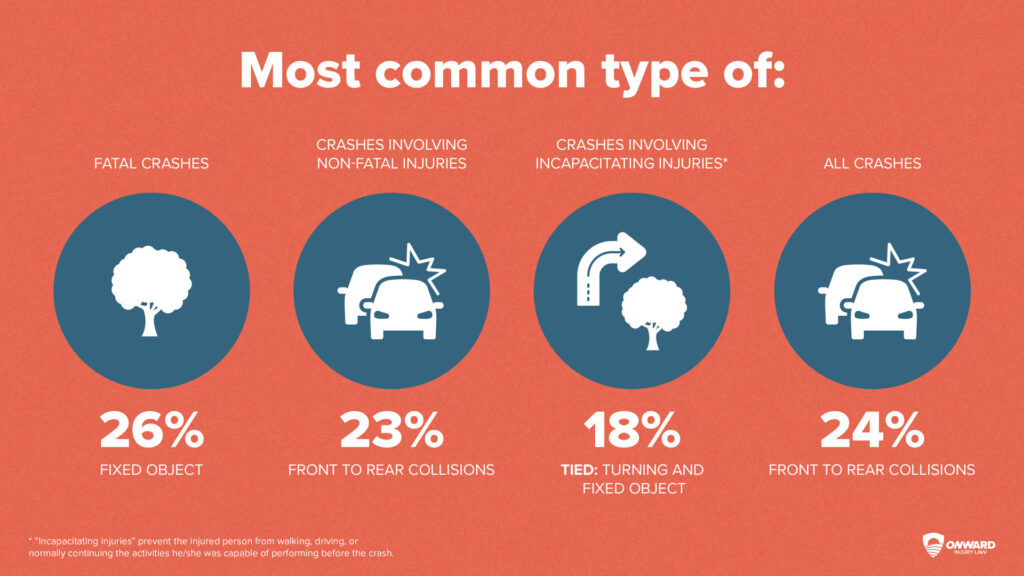
First, we’ll look at how car accidents happen here. Illinois categorizes crashes based on contributing factors such as:
- Pedestrian involvement
- Animal collisions
- Fixed-object crashes
- Turning-related incidents
These classifications help us understand the most common causes of car accidents, as well as how different types of crashes correlate with crash severity:
Next, let’s take a closer look at the driving behaviors contributing to crashes in Illinois. No matter how cautiously you drive, you can’t control the reckless choices others make—decisions that can put everyone at risk.
Here are some key insights into what some of the most common reckless driving behaviors look like on Illinois roads:
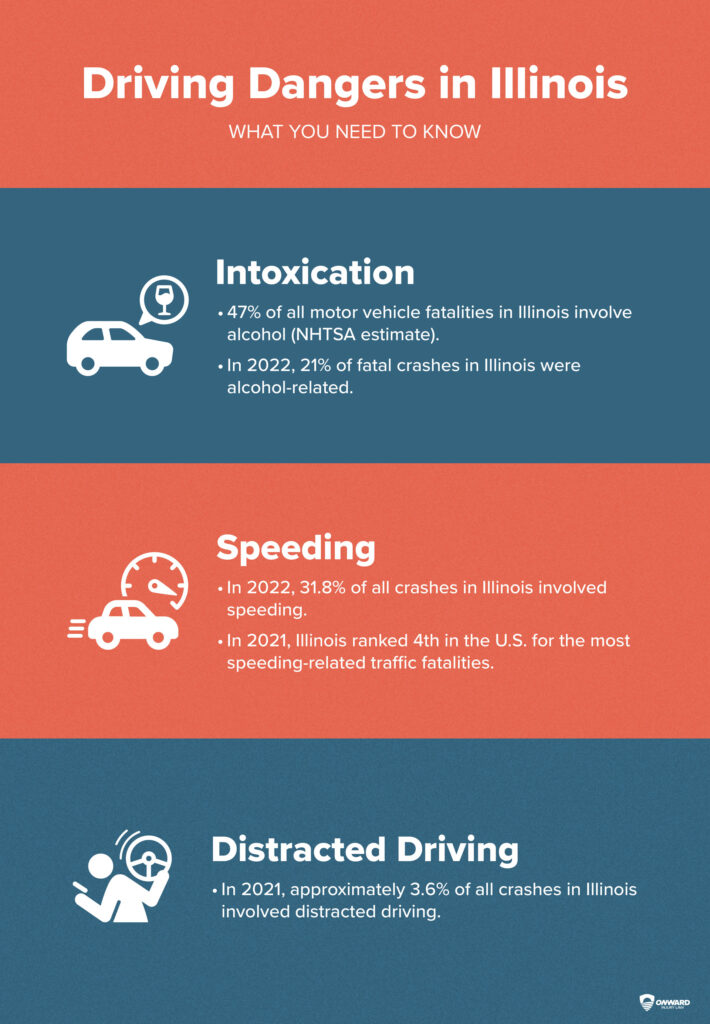
Source: Illinois Department of Transportation
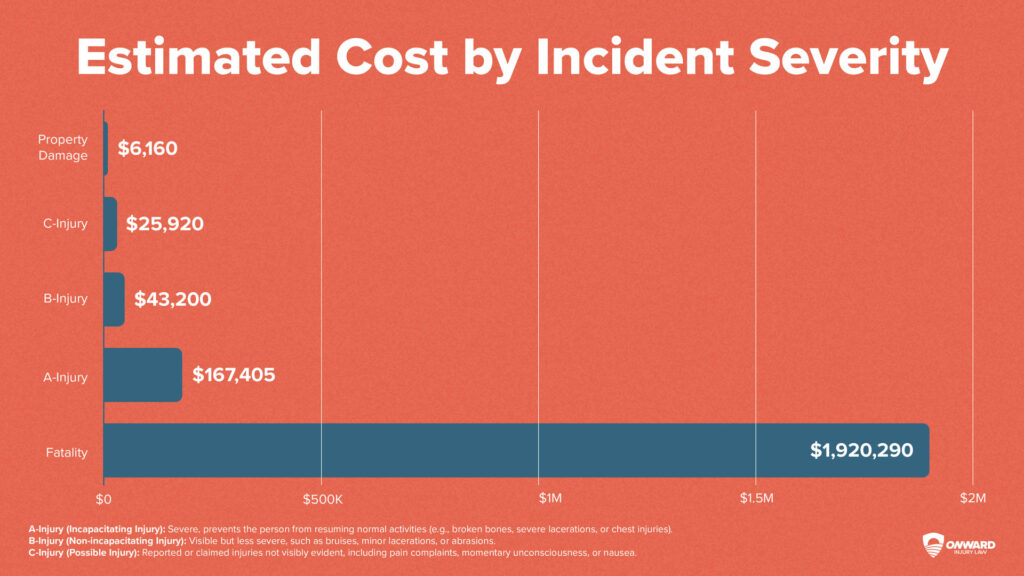
Finally, let’s cover the cost aspect of car accidents in Illinois. How can you expect to be impacted financially in the event of an unfortunate crash?
In 2022, the total estimated cost of crashes in Illinois was $8 billion. The estimated costs used to come up with this figure are a measure of the dollars spent as well as income that was not received due to crashes, injuries, and fatalities.
Here’s a closer look at how costs can differ depending on the severity of a crash:
Top 50 Most Dangerous Counties in Illinois for Car Accidents
Now you’ve gotten a bird’s-eye view of how all 102 Illinois counties compare when it comes to their crash rates relative to their populations.
Next, we’re going to zoom in and take a closer look at the top 50 most dangerous counties in Illinois for car accidents, organized using the same crash rate/1,000 residents metric we used above.
Browse this chart to see a more in-depth view of the traffic safety statistics in these counties, including how common fatal crashes and crashes causing injuries were amongst the total number of 2022 crashes recorded in each county.
Additional Key Findings:
Intoxication
To measure the impact of intoxication on crashes in these 50 counties, we analyzed county-specific crash reports and compared all the crashes for each county that fell under these categories:
- Alcohol Impairment
- Drug Impairment
- Both Alcohol & Drugs
- "Had Been Drinking"
On average, 3.69% of crashes in these counties involved alcohol, drugs, or both.
Weather
To determine what role weather played in the crashes in these top 50 counties, we once again used crash data reported by each individual county in 2022.
These reports tell us how many crashes occurred during a wide variety of weather conditions, such as:
- Severe Cross Wind
- Fog/Smoke/Haze
- Cloudy/Overcast
- Clear
By subtracting crashes that occurred in the "Clear" weather category from each county’s total crash count, we were able to determine the percentage of that county’s crashes that occurred during non-clear weather conditions.
On average, 18.54% of crashes in the 50 most dangerous counties happened during non-clear weather.
Top 10 Most Dangerous Counties in Illinois for Car Accidents
Now you know more about the traffic safety statistics in some of the most dangerous counties in IL. But if you’re thinking about visiting, moving to, or even just driving through one of the riskiest counties for car accidents, it’s important to have a deeper understanding of the factors that might be influencing that area’s crash rates.
That’s why we’re zooming in one more time to analyze the top 10 most dangerous counties on our list.
Before we go on, it’s important to note that local roadway traffic is not the only factor that can cause these regions to see higher crash rates.
Some of the counties on the “most dangerous” list happen to have highways or interstates running through them, which can inflate their total crash counts. Meanwhile, some of the “safer”-ranking counties do not have any major roadways within county limits.
It’s important to keep this in mind—just because a county has a high crash rate does not necessarily mean that that number fairly reflects the relative safety of its local roadways.
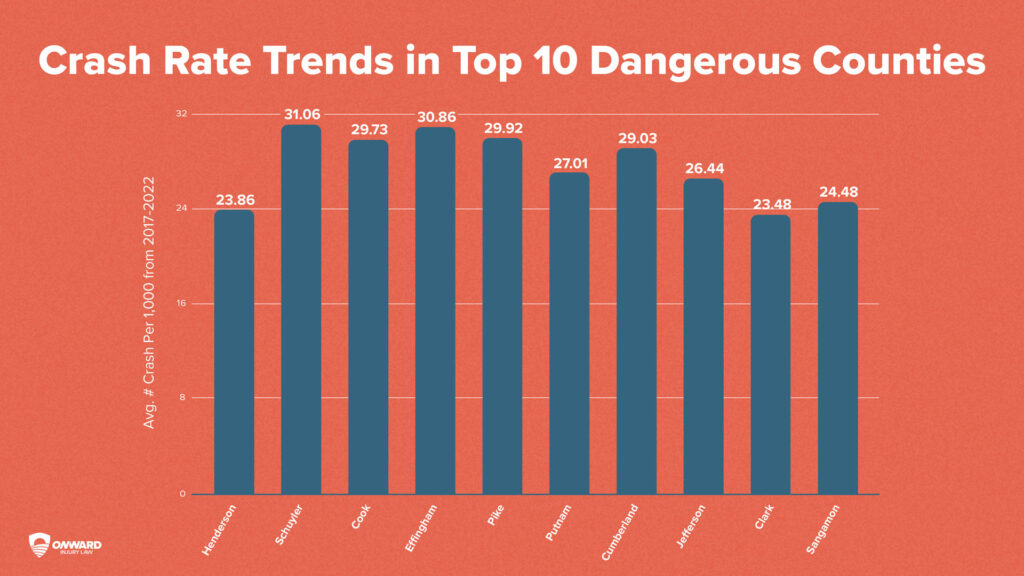
To give a more accurate picture of these top ten counties, we analyzed crash rate data spanning six years—from 2017 to 2022, not just 2022 alone. The graph below shows the average crash rate for each county over that period, offering a more reliable view of long-term trends. This way, you can better understand which counties consistently pose higher risks, rather than relying on a single year's snapshot:
Next, let’s take a brief look at what makes each county in this top ten list significant. We’ll be counting down from least to most dangerous (focusing solely on the crash rates from 2022.)
#10: Sangamon
With a total of 4,622 crashes, Sangamon County has the second-highest crash count among these top ten counties. However, it also has the second largest population on this list.
As one of Illinois's more populous counties—ranking 11th out of 102 as of 2022—this is understandable, given that it’s home to our state capital, Springfield.
In 2023, the Sangamon County Sheriff’s Office was awarded a Sustained Traffic Enforcement Program (STEP) grant to conduct additional traffic safety enforcement efforts. Sheriff Jack Campbell stated, “We’re pleased to receive this grant to step up our road safety efforts with the goal of saving lives.”
#9: Clark
Clark County, located along Illinois's eastern border with Indiana, is crossed by Interstate 70, a factor that may contribute to its higher crash numbers.
#8: Jefferson
With Interstate 57, Interstate 64, and U.S. Highway 51 all running through it, it's no surprise that Jefferson County has earned a spot on this top ten list.
If we look at this county’s 2022 crashes categorized by the type of trafficway where they occurred, we can see that the category “Rural Interstate” has the highest count at 180 crashes.
#7: Cumberland
Interstate 70 runs right through the middle of Cumberland County. Additionally, Interstate 57 crosses over the northwest corner of the county.
If we look at the classes of trafficways where accidents occurred most frequently here in 2022, “Rural Minor Arterial” (a type of road with 2+ lanes that connects cities or towns) is in the lead, with “Rural Interstate” at a close second place.
#6: Putnam
With a population of just 5,553, Putnam County has the lowest number of residents out of this top ten list. It also has the lowest total number of crashes amongst this top ten list, coming in at just 151. Interestingly, this county is the smallest in all of Illinois if we measure by area.
Putnam County was the only county in this top ten list to have zero fatal crashes in 2022.
#5: Pike
With Interstate 72 and Interstate 172 running through it, Pike County’s high crash rates may be linked in part to its major roadways.
The class of trafficway where the highest number of crashes occurred here in 2022 was “Rural Major Collector.”
#4: Effingham
According to a report by the South Central Illinois Regional Planning & Development Commission:
“Effingham County can be considered both [a] transportation and industrial hub [...] most notably due to the direct crossing of two major interstates in the City of Effingham, I-57 and I-70, and additionally I-70 provides access to I-64. Effingham County also has two major U.S. Highways, U.S. 40 and 45, which intersect in the center of the City of Effingham.”
If we look at the crash reports in Effingham County broken down by the class of trafficway on which they occurred, the “Rural Interstate” category has the highest quantity.
#3: Cook
Cook County (home to the city of Chicago) is the second-most populous county in the entire United States, beaten only by Los Angeles County in CA.
In fact, more than 40% of all Illinois residents live in Cook County (source). With a booming population of 5,111,566, it’s no surprise that car accidents happen more frequently in this county.
Of the 1,147 fatal crashes in Illinois in 2022, Cook County accounted for nearly a third, with 364.
#2: Schuyler
Interestingly, both of the top two entries on this list have fewer than 7,000 residents.
In the case of Schuyler County, a total crash count of 214 is quite high considering that the county only housed 6,753 residents in 2022. However, only one of those crashes was fatal.
While no interstates run through this county, two U.S. Highways and several IL state routes do.
As you can see in the chart above, when we consider crash rates over the six-year range of 2017-2022, Schuyler County actually takes the top spot for most dangerous.
#1: Henderson
When we analyzed crash data from 2017-2022 to create the graph at the beginning of this section, we found that Henderson County’s crash rate saw a dramatic drop in 2020, going all the way down to 10.42. While it’s certainly not the only area to experience a decline in car accidents during the pandemic, the severity of this dip is particularly striking.
We also discovered that before 2022, Henderson County was not leading in crash rate when compared to the other counties in this top ten list. What caused its surge to first place in 2022 remains unclear, but it’s important to note that this hasn’t been a consistent trend.
In fact, if we were to rank these top ten most dangerous counties based on their 2017-2022 average crash rates instead of focusing on 2022 alone, Henderson County would drop from #1 on the list to #9. However, the extreme 2020 dip mentioned before plays a big role in this dramatic shift.
Henderson County's 2022 crash report offers valuable insight into its high crash rate. If we analyze the types of reported crashes—such as fixed object, front-to-rear, and pedestrian—one category stands out by a wide margin. Of the county’s 207 total crashes, 138 were animal-related. The next highest category, fixed object crashes, trails far behind at just 29.
The Safest Counties in Illinois for Car Accidents
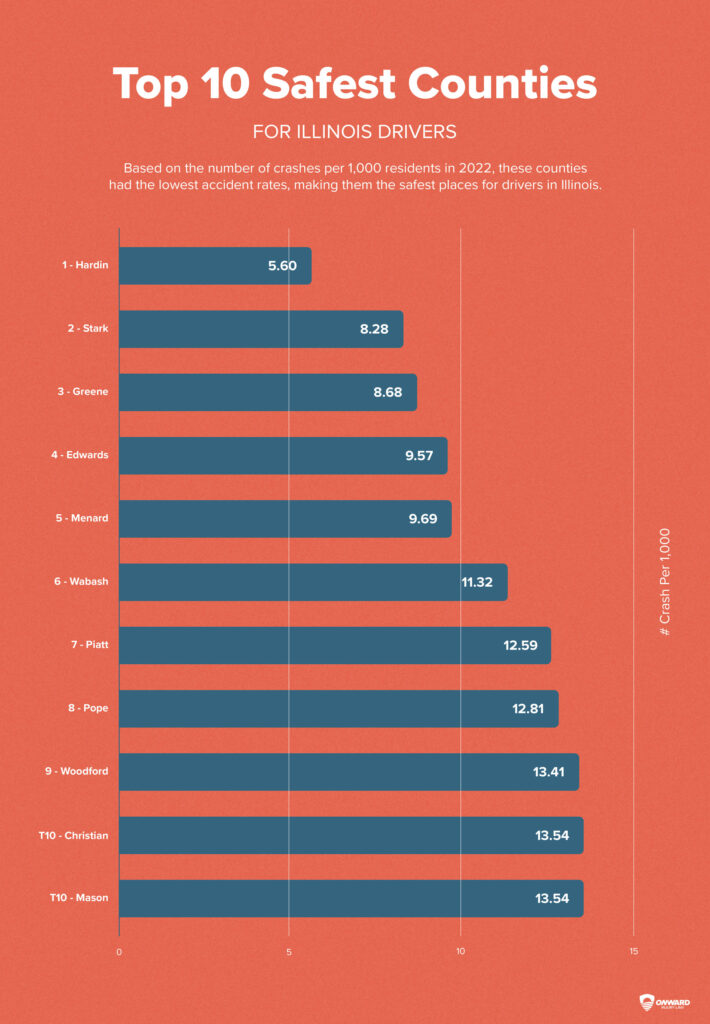
While it’s important to understand the risk factors at play in Illinois’s top ten most dangerous counties, it’s also key to take a closer look at the counties in this state that ended 2022 with the lowest crash rates.
You’ll notice that there are actually 11 counties listed in this section—that’s because two counties ended up tying for tenth place:
#10: Mason & Christian Counties (Tied at 13.5 crashes/1K residents)
Although Christian County and Mason County are tied for 10th place, the population of Christian County is more than 2.5 times bigger than that of Mason.
With a population of 12,699, Mason County only experienced 172 crashes.
Meanwhile, Christian County has a population of 33,390 residents, and it saw 452 total crashes. Notably, there were 6 traffic-related fatalities in Christian County in 2022. Only one other entry on this list of the safest counties saw a fatality total that high.
#9: Woodford
With a population of 38,177, Woodford County boasts the largest population on this top 11 list. Yet, despite its size, the county has maintained an impressively low crash rate.
512 crashes occurred here in 2022, resulting in a total of 6 fatalities.
#8: Pope
Pope County only saw 48 total crashes in 2022. Even though it ranks as the 8th safest county when we consider the metric of crash rates, it would rank as the 3rd safest county if we were measuring instead by lowest total number of crashes.
Pope County also comes in second place for the lowest populated county in all of IL.
Together with the #1 ranked county on this list, Hardin County, Pope County is largely situated within Shawnee National Forest.
In 2022, there were zero traffic-related fatalities within the county.
#7: Piatt
Despite the fact that both Interstate 72 and Interstate 74 cross through this county, it has achieved a significantly low crash rate.
To put this into context, the Illinois county with the highest 2022 crash rate, Henderson County, had 207 crashes but a population of only 6,168. Meanwhile, Piatt County had a similar crash total at 210, but its population is almost 3 times larger at 16,675.
In 2022, there were zero traffic-related fatalities in Piatt County.
#6: Wabash
When we measure by area, Wabash County is the fifth smallest county in Illinois. While state roadways like Illinois Route 1 and Illinois Route 15 run through this county, no interstates cross within its borders.
In 2022, there were zero traffic-related fatalities in Wabash County.
#5: Menard
Menard marks our transition into the top 5 safest counties in IL. From this point on, all the counties mentioned have crash rates under 10.
While Menard County is directly north of Sangamon County, which holds the state capital of Springfield and ranked as one of the most dangerous counties on our list, no interstates pass through Menard County. In 2022, there were zero traffic-related fatalities here.
#4: Edwards
The fourth entry on our safest list and the fourth smallest county in IL by area, Edwards County does not have any interstates running through it. It also has a small population of just 6,058.
#3: Greene
Although U.S. Highway 67 does run through Greene County, there are no interstates that pass through its borders.
With 11,640 residents, Greene County has more than double the population of each of the two safest counties on our list.
#2: Stark
With just 44 total crashes, Stark County holds the second lowest crash count and the second lowest crash rate on our list.
Stark County had a population of just 5,313 in 2022. With such a small number of residents, it’s likely that the roads in Stark County are less congested than other counties in Illinois, helping it maintain a lower number of car accidents.
Additionally, no interstates pass through this county, and this lack of high-speed roadways likely plays a key role in its high traffic safety ranking.
#1: Hardin
Hardin County not only has the lowest crash rate in IL, it also has the lowest number of crashes in the entire state of IL—coming in at just 20 car accidents total.
Another title that Hardin wins is the smallest population of any IL county. It makes sense that with fewer drivers on the road and decreased roadway congestion, the streets of Hardin County would be safer than most. On top of that, Hardin County is the second smallest county in the state by area.
Just like Pope County, Hardin County is situated partially within the Shawnee National Forest area of Southern Illinois. No interstates cross within its borders.
In 2022, there were zero traffic-related fatalities in Hardin County.
Get the Compensation You Deserve After a Crash with Onward Injury Law
Here at Onward Injury Law, we help those who are injured or grieving stand up to insurance companies. Our team of experienced Illinois personal injury lawyers has recovered millions of dollars for our clients. No matter what your situation looks like, we’re here to help you determine the best path forward, maximize your compensation, and ensure that your medical bills are taken care of so you can focus on healing and recovering after a traumatic incident.
Schedule a free consultation today, and our team will review your case at no cost to determine what options are available to you. We’re here to help and ready to listen.
Share this article